Just about every time I get into a discussion (or attend a panel session/workshop) on subwoofer systems, the issue of array efficiency comes up. This is fair enough. When we’re dealing with direct-radiator loudspeakers, we’re only looking at 2-3% (or so) efficiency (if you’re lucky) in the conversion from electrical to acoustical energy. When you’re losing the vast majority of your input energy to heat, it’s essential to squeeze out every last Watt you can of acoustical energy.
Now, when talking about efficiency in terms of live sound subwoofer systems I think there’s quite a bit of confusion. How are we quantifying efficiency? Are we quantifying efficiency? I suspect in many cases we’re not…
It’s a virtual guarantee that anytime you bring up amplitude tapering (a.k.a. shading) of subwoofer arrays to reduce strong side lobes in the polar response you’ll be met with the response something along the lines of, “Yeah, that’s good and all, but it kills the array’s efficiency.” On the face of it, this argument is sensible. In progressively reducing the amplitude fed into the each subwoofer as you move outwards from the center of the array it only makes sense that the overall system output would be less. Less power in equals less power out. Right…?
I’m not so sure about this, and here’s why. When we talk about efficiency of any device it is simply the ratio of the output power to the input power. When dealing with a loudspeaker system and a single “sweet spot” this is straightforward. When dealing with a subwoofer array, however, you have multiple loudspeakers radiating correlated signals over a wide audience area. We’re not necessarily interested in the simple relationship between electrical input power and acoustical power received at a single point. The scenario is much more complicated. The question here is how do we actually quantify system efficiency in a meaningful and useful manner?
Let’s begin with a simple scenario. You have a small 4-unit subwoofer array spaced so that you achieve coupling up to 60 Hz (2.9 m unit-to-unit spacing) as shown in the figure below.
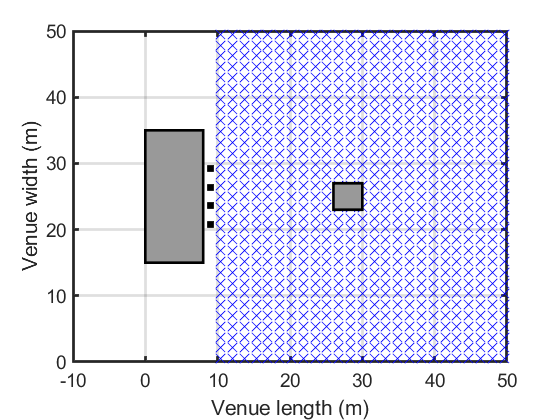
Example 4-unit array layout (black boxes = subwoofers, blue crosses = measurement points, gray boxes = stage/FOH)
Now, it’s all well and good to look at colorful plots and squiggly lines on a graph to judge system performance, but I think it’s more useful to have a single metric to quantify this. While I’ll be going into all the gory detail of my ideas on this when I present a paper at AES Milan, here are the basics. I use a single metric called Array Performance Rating (APR). This encompasses three individual measurements: (1) tonal consistency (how much the magnitude response varies from point to point across the audience, quantified using spatial variance), (2) system headroom (based on the difference between your target SPL at FOH and the maximum SPL achievable at FOH before clipping), and (3) audience and FOH consistency (where the target is to have the overall SPL at FOH closely agree with the bulk of the audience in order to avoid bass heavy/light mixes due to a disagreement between FOH and the audience).
While I don’t want to go into APR in detail in this post (if you’re interested read the AES paper once it’s released!), I do want to use APR as a way to highlight a better way to judge system efficiency. Let’s have a look…
First let’s set out what we’re shooting for. Let’s say we want an (arbitrary) low-frequency SPL (unweighted) of 115 dB at FOH. Let’s also say that the peak output from any individual subwoofer will be limited to 140 dB. Also, each subwoofer indicated in the above figure will represent a stack of two subwoofers (so we actually have eight units in total)
OK… now let’s look at the SPL distribution over the audience at 60 Hz (I know… colorful plots and squiggly lines… but bear with me!):

Audience SPL (dB) distribution at 60 Hz for the unprocessed 4-unit subwoofer array
This is what many system engineers inspect when designing subwoofer arrays. It’s a great visual representation of what’s happening, but it’s important to remember that it only represents a single frequency. Let’s look at what’s happening across the subwoofer band (we’ll define that as 20 – 100 Hz for this example).

Magnitude responses across all measurement points in the audience with relevant metrics for the unprocessed 4-unit subwoofer array
The first thing you notice is that the magnitude responses don’t agree with each other. At certain frequencies there is up to 30 dB difference between listening locations. This doesn’t bode well for tonal consistency (represented with a spatial variance (SV) of about 11 dB). In terms of efficiency, we’re achieving about about 112 dB SPL at FOH. This is 3 dB off our target, so we’ll lose 3 dB in system headroom to achieve our target SPL of 115 dB. This leaves 17 dB headroom, which most engineers should be fairly happy with!
We still have the issue, though, of lack of tonal consistency (SV = 11 dB) and poor agreement between FOH and the audience (an average difference of about 10 dB). This needs to be addressed (I should note at this point that APR is 0.44 (D grade) for this unprocessed system – the rating scale is shown below).

OK, let’s do the easy stuff first. We can apply electronic delay to the subwoofers based on a calibration point behind the array. After running one of my programs to find the optimal delay point (I’m going to release the FREE software this summer – stay tuned!) and then applying the corresponding delay, we can judge how we did. I’ll show the same plots as I did before, to allow for a direct comparison.


So things are looking better in some areas and worse in others. Tonal consistency is improved (spatial variance dropped from 10.6 dB to 7.2 dB) and FOH and audience levels are in much better agreement (only about 3 dB off rather than 10 dB). We’ve lost about 4.5 dB of headroom with this process, though. This is a result of a loss of the power alley, central in the audience area (and in line with FOH). APR has risen to 0.52 (C grade).
At this point, the question must be asked: is this apparent loss of efficiency bad? We still have over 12 dB of system headroom and the audience (and FOH) is receiving a much more consistent listening experience. I’d say this is a step in the right direction. Interestingly, I never hear any engineer complain about loss of efficiency when delaying his/her subwoofer array…
Now, I’m going to apply another easy trick to improve system performance. I call it position compensation, but this is probably a bad choice of term… need to have a think about it! In any case, what I do is gradually decrease the unit-to-unit spacing as we move from the center of the array outward. This is to compensate for the change in effective subwoofer positioning due to the electronic delay (as seen by the red boxes in the above layout figure). This is intended to improve performance at the upper end of the subwoofer frequency range. Let’s take a look at whether this helps or not (it doesn’t always help).


We’re still sitting at a C-grade APR (0.61), but tonal consistency (spatial variance) and system efficiency (headroom) have both improved. We now have an extra 2 dB or so of headroom at very little cost (slightly worse agreement between FOH and audience levels).
Now we come to amplitude tapering. As can be seen from the 60 Hz SPL distribution plot above, there is some lobing happening across the audience. Amplitude tapering should help alleviate this issue. Let’s see…


In this case I’ve used a Tukey window for tapering purposes with a coefficient of 0.7 (found through an optimization procedure). The changes aren’t drastic, with most metrics remaining roughly the same. Spatial variance, though, has decreased to 1.8 dB meaning that there is excellent tonal consistency, but we’ve lost about 1.5 dB of system headroom. It’s important to realize, though, that the headroom this system supports is greater than that of the delayed system! APR has risen to 0.63 (high C-grade). This is very good for such an undersized and widely spaced system.
Now, back to efficiency. How are we meant to quantify system efficiency? Should it just be based on SPL at FOH or should it take into consideration of audience coverage as well? I think that we need to consider the system’s total coverage when talking about efficiency. With only FOH in mind, it seems the worst thing you can do is apply delay to your subwoofers to widen the coverage. This will inevitably reduce FOH SPL, thus giving a reduction in apparent efficiency.
I support the opposite notion. The reduction in FOH SPL is for the benefit of the audience (they receive more equal listening experiences), not to mention it helps to ensure the FOH engineer is receiving a good approximation of what the audience is hearing. Yes, it may be disconcerting to purposefully not use all of your amplification power (when using amplitude tapering), but if this helps to achieve better tonal consistency and FOH/audience agreement, then isn’t that a good thing?
Anyway, this post has gone on far longer that I thought it would. The point is this: system efficiency is essential to consider. Without adequate headroom, you won’t be able to have an acceptable sounding show at the desired levels. This doesn’t mean we can only measure SPL at FOH to judge efficiency. We must look at the audience as well. This is where simulation tools are essential.
So next time someone tells you to never use amplitude tapering/shading since it kills efficiency, ask them what they’re basing that claim on. It probably has very little to do with the audience experience – and we must remember who’s ultimately paying our salary!
Fascinating and clear. Many thanks. Great work. It seems the ‘efficiency’ consideration that’s being cited is perhaps grasping at a concept more of ultimate capacity. Given the excessive levels of sub at so many events, and the appetitite to throw more hardware and power supply at it, I don’t feel capacity is a real problem when compared with consistency, and the quality of the mix judgement. So I agree with your sense of priorities being set out here.
Thanks for the article, Adam! Good work! Looking forward to Milan paper! 😉